Claim charts
Generating claim charts
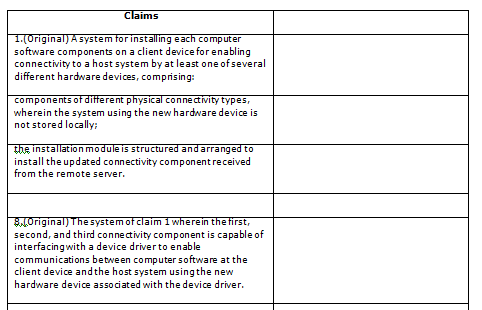
ClaimMaster lets you to quickly chart the parsed claims, as shown below. Claim charts may include multiple columns, with claim text positioned in the left-most column and broken up by claim limitations.
Getting Started
To generate a claim chart, perform the following steps:
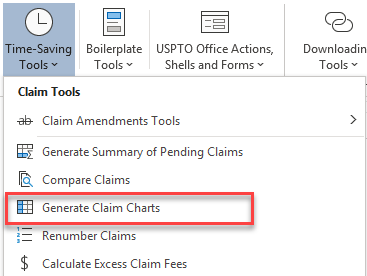
- From the ClaimMaster Ribbon, click on the Time-Saving Tools menu, then Generate Claim Charts:
Feature Options
Once you start this feature, ClaimMaster will prompt you to select the claims for charting, as well as the number of columns and font preferences for the charts, as shown below. Once you make your selection, click "Generate Claim Charts" to create charts of the selected claims.
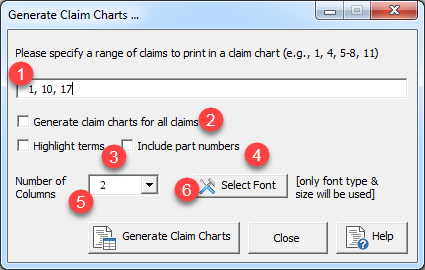
- Specify a set of claim numbers or a claim range to chart. Example: “1, 3, 5-8, 18-24”. Type “ALL” (caps) to chart all parsed claims
- You can also select this checkbox to print all claims.
- If this checkbox is selected, the software will highlight the parsed claim terms inside of the claim chart in bold font.
- If this checkbox is selected, the software will identify part numbers in the document and list them in parentheses next to the claim terms. For example: "sending an image to the image processing system (118, 218)"
- Specify the number of columns in the resulting claim chart
- You can also specify fonts & font sizes used in the claim chart.