Generating claim charts with LLMs
Generating Claim Charts with LLMs
ClaimMaster can also fill out charts for the claims in the currently open Word document with information obtained from the LLM. For example, you can ask LLM to summarize claims or specific claim limitations for you, etc. To generate claim charts, make sure you have a document open that contains claims. Also, make sure your LLM prompt type is set to "claim chart".

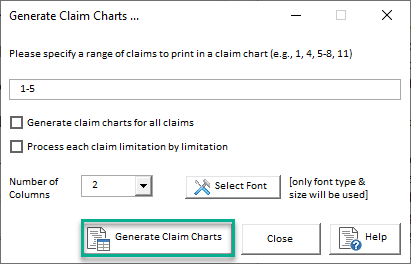
When "claim chart" option is selected, when you click on "Send prompt to LLM" button, you'll be presented with the window that lets you select a set of claims for charting. Once you specify which claims to chart, click on "Generate Claim Charts" to proceed with the process.
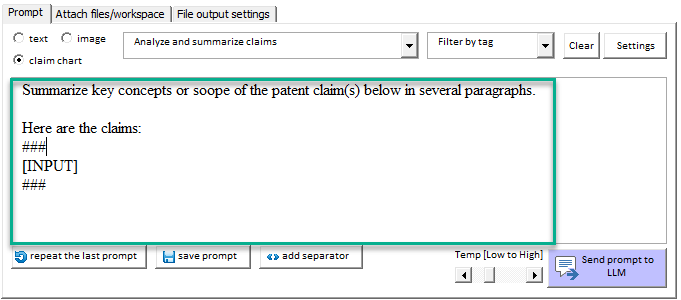
The LLM prompt that would be used for claim charting needs to have an [INPUT] field. For each specified claim to chart, ClaimMaster will pass that claim as [INPUT] to the configured LLM for summarizing, analysis, comparison to prior art, etc.
You can also attach documents, such as prior art or other literature, for comparison to the claims. For example, the prompt below will summarize each selected claim:
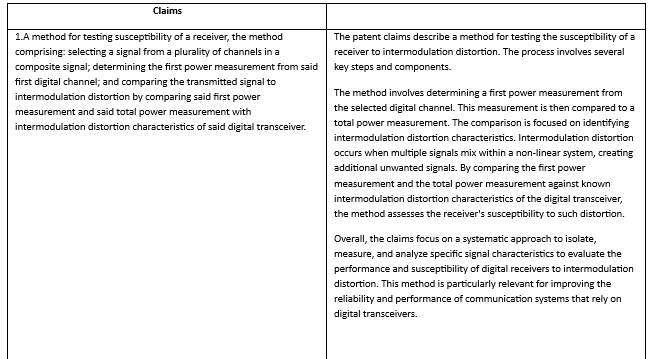
Once charting is complete, the result will be a claim chart Word document that has the selected claims listed in the left column and LLM summary/analysis in the right column for each of the claims: