ClaimMaster makes it incredibly easy to generate claim charts. The generated charts can include multiple columns, with claim text positioned in the left-most column and broken up by claim limitations. The charts can also include part names and numbers identified in the specification.
To generate claim charts, perform the following steps:
- Launch the Claim Charting Tool
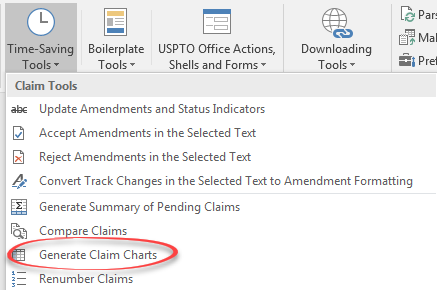
In ClaimMaster tab, click on the Time-Saving Tools menu, then Generate Claim Charts:
- Specify the Claims to Chart
ClaimMaster will next prompt you to select the claims for charting, as well as the number of columns and font preferences for the charts, as shown below. Here you can also specify whether to highlight the parsed claim terms inside of the chart in bold font. In addition, you can have ClaimMaster identify and list part numbers in parentheses next to the claim terms, such as: “sending an image to the image processing system (118, 218)”.

- Generate Claim Chart
Once you make your selections, click “Generate Claim Charts” to create charts of the selected claims.
If you generate a standard chart, it will have claim text/limitations on the left and an empty column(s) on the right.

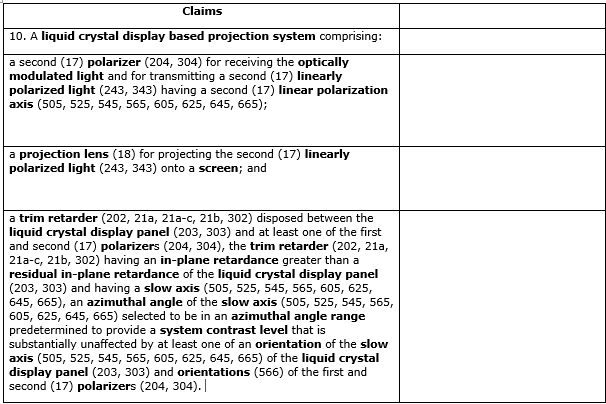
If you also select to highlight the terms/add part numbers, the chart will look like a screenshot shown below.
That’s it! Now you have a basic charts in a matter of seconds.
For more information on this feature, check out the Online Manual.